First exhibit: Openness to Trade

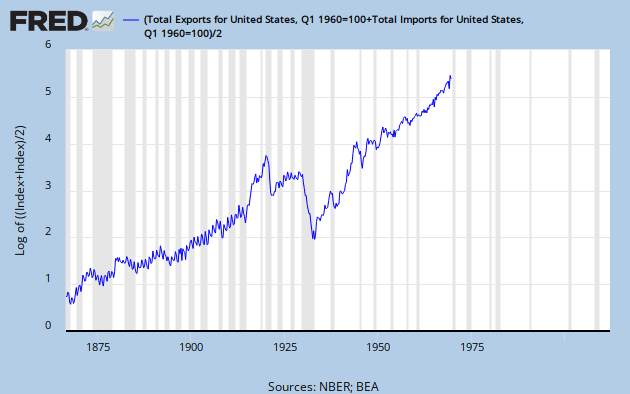
While the Bretton Woods period after the Gold Standard is typically characterized as a dark era for international trade, in reality trade grew at a steady clip. From 1870 to 1944, trade grew an average of 4.0% every year, whereas during the Bretton Woods period, from 1944 to 1971, trade grew at about 6.6% per year. However, after the breakup of Bretton Woods, trade boomed, with yearly growth in trade averaging 9.6%. This corroborates Evan's analysis that trade went parabolic in the 1970's as global trade barriers steadily went down. I've graphed the data below in terms of log of the index, so the distance between two vertical values is actually a measure of percent change, making historical comparisons much simpler.
Looking at the data, we can also see that, among the post war recessions, trade has fallen the most in percentage terms in the Great Recession than in any other recession. A close inspection indicates that it still has not caught up with the pre-recession trend, but an even closer inspection indicates that the lack of catch-up growth should not be too surprising, as in the last two recessions, trade never caught up to the pre-crisis trend.
Second exhibit: Price Stability

Prices were incredibly stable during the Gold Standard era, to the point of bordering on pathology. The prospect of decades of deflation is unthinkable now, but it was something that Americans had to deal with during the time period from 1880 to 1900. It's amazing to think that the price level was fundamentally controlled by gold discoveries, as the mid 1860's boom in the price level can be directly traced to the gold rush during that time period. Yet as production rose, the price level fell, the natural result of a commodity price regime in which the supply of the commodity is severely limited.
The behavior of prices during the interwar period is also interesting, as prices doubled with the beginning of World War I, and then collapsed 40% with the onset of the Great Depression. And during the Great Depression, although FDR's dollar debasement strategy did work to significantly raise the price level, it was not enough to return it to its pre-war trend before he cut it off with his policy reversals in 1937.
Third Exhibit: Turn of the Century Wage Levels

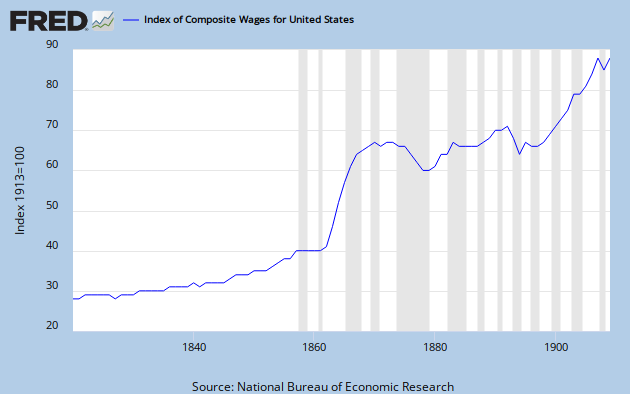
This provides an interesting complement to the price stability graph because it seems to show that the rise and fall in the price level were the ultimate drivers of the wage rate, and not so much other factors such as the extremely large flows of immigrants in the late 1800's and early 1900's. By looking at the graph, it would be impossible to try to pin down when immigration was at its highest or when restrictions on immigrants were put into place. This goes down as a historical point to explain in debates about unskilled immigration and wage rates, a some of the most prosperous periods of American history took place side by side with large immigration flows. On the other hand, hard money seems to be a serious issue holding back wage growth, so this graph should help in showing how problematic the Gold Standard truly was and how a similar commodity standard today would be seriously detrimental to necessary growth in nominal GDP.
Yi-chuan, did you take a look at the 1920-1921 depression? I've sent you an article on the subject via e-mail before.
ReplyDeleteIf you don't remember it, it was a 2011 article published in the Review of Austrian Economics criticising Jim Powell, Thomas Woods, and Robert Murphy on the Austrian/libertarian account of the said depression. The reason I e-mailed you the article was because I thought you might be interested in the Federal Reserve's response to the 1920-1921 depression, which according to Daniel Kuehn, was much more "insightful" than many scholars have given credit for. Just for everyone's reference, here's the link to the article.
http://www.springerlink.com/content/5683j4v650187261/