An important problem with NGDP targeting is data frequency. NGDP data only comes in every quarter, and is also subject to large revisions. This is one of the stronger arguments against NGDP targeting, as the lack of data makes it hard for the market to check that policy makers are hitting their targets. Expectations don't always match reality, so it's important to have a concrete and frequently updated data source to monitor the economy.
Evan, in his musings on level and rate targeting, offers a theoretically robust alternative in the current world of flexible inflation targeting. From his post (my emphasis):
Third, given a mixed rate/level targeting regime, the Fed has what should be the rate and what should be the level backward. In the long run, the Fed has almost no control over the unemployment rate, yet almost total control over the price level; in the short run, it does have some control over real variables such as unemployment. Given those constraints, it makes far more sense to level-target the variable which the Fed controls in the long and short runs, i.e. the price level, and to rate-target the variable over which the Fed has some control in the short run, i.e. change in nonfarm payroll employment or quarterly real output growth.:
As I commented before, such an arrangement would be aligned with Okun's law, which states that year over year falls in unemployment is approximately equal to year over year real GDP growth minus 3. As a result, in Evan's formulation, the combination of change in unemployment and the change in the price level would approximate an NGDP target. His other alternative, nonfarm payroll employment, is what I want to test in this post.
Armed with the requisite FRED data, I looked to see if I could find a simple econometric relationship between YoY NGDP growth, YoY nonfarm employment growth, and YoY Headline CPI growth. In other words, I tested the relationship:
NGDP Growth = a*Inflation + b*%ΔEmployment + Constant + Error
As I'm interested in how the rule would help guide policy in the most recent "Great Recession", I calibrated the data on pre-crisis, 1948-2006 data and then saw how the model predicted NGDP growth "out of sample" for 2007-2012. It turns out that nonfarm payroll, inflation, and NGDP do form a rather tight relationship (note that I use headline inflation. Core inflation does not substantially change the conclusions). The precise rule that I get from the calibration is:
NGDP Growth = 0.517*Inflation + 1.083*%ΔEmployment + 2.968
But if we're looking for a more general, simpler rule of thumb, we can approximate it to:
NGDP Growth = 0.5*Inflation + 1*%ΔEmployment + 3
From here, we can compare the time series of the simple approximation to actual NGDP growth.
We can easily see that the measure does quite well throughout the historical period. I've already divided the graph as Marcus Nunes does for each central banking "regime", and it's clear that the composite measure exhibits the same trends as Marcus shows in his NGDP graphs.
What you do see is that, even in the out of sample period, the time series match up well. Around the end the composite measure does spike to 6% while actual NGDP growth is around 4%. However, in spite of that differential, the rule still makes very good out of sample predictions for the 2007-2012 time period:
Interestingly enough, the regression coefficient has been around one, which means there's an approximate one to one relationship between actual NGDP growth and the composite measure. About 80 percent of the variance in the composite measure is explained by the variance in NGDP growth. Of course, the relationship is not perfect, but it's really quite amazing how well the out of sample prediction holds up. So before the Fed establishes an NGDP futures targeting regime to help with the data availability problem, it can still use monthly available statistics such as CPI and changes in nonfarm payroll to approximate an NGDP target. When actual NGDP data comes out, that quarterly data can be checked against the composite measure. The higher data frequency would help cement in the Fed's credibility as the regime could be checked, thereby smoothing and enabling a transition to a full fledged NGDP level targeting regime.
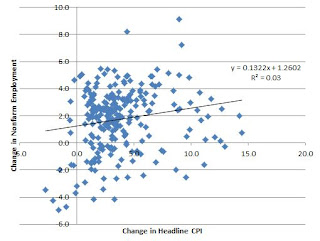
P.S. While playing with the data, a statistically significant relationship between inflation and employment growth emerges. 95 confidence interval on the slope returns (0.04, 0.22). Pseudo-Philips Curve, anyone?


No comments:
Post a Comment